Table of Contents
In non ideal reactor C Curve, E Curve and F Curve are produced from the analysis of pulse or step input tracer experiment. This gives an information to understand the movement and distribution of materials within the reactor.
These Curves provides insights into Residence Time Distribution (RTD) of material, which reveals the intricacies of flow patterns and helps in diagnosing common issues such as channeling, bypassing and dead zones within the reactor.
Related: Ideal Batch Reactor – Material Balance and Performance equation Calculations
Related: Arrhenius Activation Energy Calculator for two temperatures
RTD Measurement with Tracer Experiment
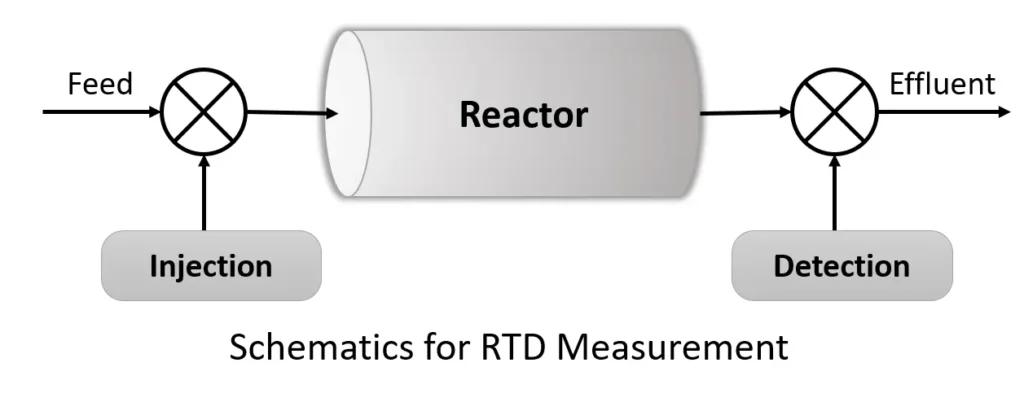
RTD is determined experimentally by injecting an inert tracer into the reactor at time, t=0. The tracer concentration, C in the effluent stream (exit stream) is then measured as a function of time. The schematics are shown in the figure given below:
Note: A tracer must be non-reactive, easily detectable, have similar physical properties to the reacting mixture, and not adsorb on reactor surface. The commonly used tracers are colored and radioactive materials. The two most used methods of injection are pulse input and step input.
Related: Residence Time Distribution in CSTR and PFR – Model with Python Code
Pulse Input Experiment
In a pulse input, a known amount of tracer is injected suddenly in single shot within the feed stream entering the reactor.
The outlet concentration of tracer is then measured as a function of time in the effluent stream which is plotted as concentration vs time and it is referred as C Curve in the RTD analysis.

The residence time distribution function (E(t)) represents the fraction of material leaving the reactor at time (t) that has spent a residence time (t) inside the reactor. In integral form, it gives the cumulative fraction of tracer that has exited the reactor up to time (t).
Therefore, the total fraction of tracer that has exited the reactor from time t1 to time t2 is given by:
\[\text{Fraction of material} = \int_{t_1}^{t_2} E(t) \, dt\]
As all the material must exit the reactor, the total fraction of material that has spent any residence time in the reactor is 1:
\[\int_0^{\infty} E(t) \, dt = 1\]

Edition: 3rd Edition, By: Octave Levenspiel
A classic textbook covering the principles of chemical reaction engineering with detailed analysis of reactor design and kinetics.
Buy on AmazonIn the case of a pulse injection of tracer, the tracer concentration (C(t)) is measured at the reactor outlet as a function of time. The total amount of tracer injected is N0 and the total amount of tracer exiting the reactor is:
\[N_0 = \int_0^{\infty} v C(t) \, dt\]
here, the volumetric flow rate \(v\) is usually constant, so we can define the residence time distribution function E(t) as:
\[E(t) = \frac{C(t)}{\int_0^{\infty} C(t) \, dt}\]
This expression shows that E(t) is the normalized concentration curve and describes the time distribution of fluid elements leaving the reactor.
E(t) is used to characterize the flow pattern within a reactor and is especially useful in diagnosing deviations from ideal behavior (such as perfect mixing or plug flow).
Note: The E-curve is just the C-curve divided by the area under the C-curve.
Related: Plug Flow Reactor – Design Equation and Calculations
Related: PFR and CSTR in Series or Parallel Combination for a single reaction
Step Tracer Experiment
A step input tracer is introduced into the reactor at a constant concentration. This means that a known amount of tracer is injected into the flow stream suddenly which leads to an immediate change in the concentration of the tracer in the inlet.
Tracer samples are taken at the outlet at different time intervals to measure the concentration of the tracer in the effluent stream. This concentration data is then integrated over time to produce the cumulative distribution function F(t).
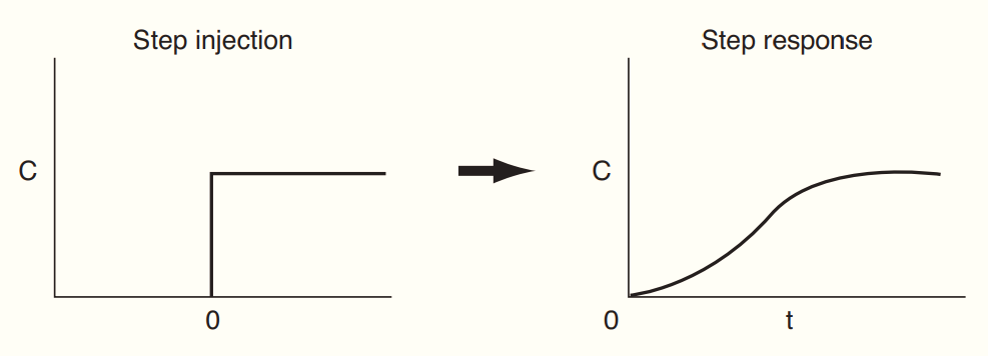
This cumulative distribution F(t) represents the fraction of material that has been present in the reactor for a time t or less, which provides insights on system behavior.
Note: As we have understood the RTD function E(t) can be directly determined from a pulse input, the cumulative distribution function F(t) can be directly derived from a step input.
Related: Conversion, Selectivity, Yield for a multiple reaction
The relationship between the inlet and outlet concentration can be shown by normalizing F(t) as a fraction of the total tracer injected and is given as:
\[C(t) = C_0 \cdot F(t)\]
where, C0 is the concentration of tracer in the inlet stream
The F-curve F(t) is derived by integrating the normalized concentration over time:
\[ F(t) = \int_0^t E(\tau) \, d\tau \]
Note: These relationships show how stimulus-response experiments, using either step or pulse inputs can conveniently give the RTD and mean flow rate of fluid in the vessel. Remember these relationships only hold for closed vessels.
Related: Mixed Flow Reactor – Design Equation and Calculations
Construct C Curve, E Curve and F Curve
A sample of the tracer hytane at 320 K was injected as a pulse into a reactor, and the effluent concentration was measured as a function of time, resulting in the data shown in Table below:
| Time (t), (min.) | Concentration (C), (g/m³) |
|---|---|
| 0 | 0 |
| 0.5 | 0.6 |
| 1 | 1.4 |
| 2 | 5 |
| 3 | 8 |
| 4 | 10 |
| 5 | 8 |
| 6 | 6 |
| 7 | 4 |
| 8 | 3 |
| 9 | 2.2 |
| 10 | 1.5 |
| 12 | 0.6 |
| 14 | 0 |
The measurements represent the exact concentrations at the times listed and not average values between the various sampling tests.
- Construct a figure showing the tracer concentration C(t) as a function of time.
- Construct a figure showing E(t) as a function of time.
- Construct the F(t) curve.
- Calculate the mean residence time, tm.
Solution:
1. For the given data of concentration vs time, we have plotted the C Curve, which shows the tracer concentration C(t) as a function of time.

Now, we will calculate the area under this C curve using numerical integration methods (solving this in python using trapezoidal rule)
import numpy as np
import matplotlib.pyplot as plt
from scipy.integrate import trapz

# Given data
time = np.array([0, 0.5, 1, 2, 3, 4, 5, 6, 7, 8, 9, 10, 12, 14])
concentration = np.array([0, 0.6, 1.4, 5, 8, 10, 8, 6, 4, 3, 2.2, 1.5, 0.6, 0])

# Calculate the area under the curve using the trapezoidal rule
area = trapz(concentration, time)

# Display the area result
print(f"The area under the curve is: {area:.2f} g·min/m³")
Output: The area under the curve is: 51.00 g·min/m³
2. To Construct the E(t) curve, we will be using the formula given below:
\[E(t) = \frac{C(t)}{\int_0^\infty C(t) \, dt} = \frac{C(t)}{A}\]
We have the area, A (i.e., 51 g•min/m3), under the C-curve, therefore, we can construct the E(t) curves. We now calculate E(t) by dividing each point on the C(t) curve by 51.0 g•min/m3
\[E(t) = \frac{C(t)}{51}\]
Data table for constructing E curve is shown below:
| Time (t) (min.) | Conc. (t) (g/m³) | E(t) (min-1) |
|---|---|---|
| 0 | 0 | 0.000 |
| 0.5 | 0.6 | 0.012 |
| 1 | 1.4 | 0.027 |
| 2 | 5 | 0.098 |
| 3 | 8 | 0.157 |
| 4 | 10 | 0.196 |
| 5 | 8 | 0.157 |
| 6 | 6 | 0.118 |
| 7 | 4 | 0.078 |
| 8 | 3 | 0.059 |
| 9 | 2.2 | 0.043 |
| 10 | 1.5 | 0.029 |
| 12 | 0.6 | 0.012 |
| 14 | 0 | 0.000 |
Plotting the E curve, we get – refer python code to plot this data – click here

3. To Construct the F(t) Curve, we integrate the E(t) function, therefore we get the following table as
| Time (t) (min.) | C(t) (g/m³) | E(t) (min-1) | F(t) |
|---|---|---|---|
| 0 | 0 | 0.00 | 0 |
| 0.5 | 0.6 | 0.01 | 0.01 |
| 1 | 1.4 | 0.03 | 0.04 |
| 2 | 5 | 0.10 | 0.14 |
| 3 | 8 | 0.16 | 0.29 |
| 4 | 10 | 0.20 | 0.49 |
| 5 | 8 | 0.16 | 0.65 |
| 6 | 6 | 0.12 | 0.76 |
| 7 | 4 | 0.08 | 0.84 |
| 8 | 3 | 0.06 | 0.90 |
| 9 | 2.2 | 0.04 | 0.95 |
| 10 | 1.5 | 0.03 | 0.97 |
| 12 | 0.6 | 0.01 | 0.99 |
| 14 | 0 | 0.00 | 0.99 |
Plotting the E curve, we get – refer python code to plot this data – click here

4. To Calculate the Mean Residence time, we will be using the following formula:
\[\tau_m = \int_0^\infty t E(t) \, dt\]
solving the same with the python code, we get
import numpy as np
from scipy.interpolate import make_interp_spline
from scipy.integrate import trapz

# Given data
time = np.array([0, 0.5, 1, 2, 3, 4, 5, 6, 7, 8, 9, 10, 12, 14])
E_t = np.array([0.00, 0.01, 0.03, 0.10, 0.16, 0.20, 0.16, 0.12, 0.08, 0.06, 0.04, 0.03, 0.01, 0.00])

# Generate smooth curve using cubic spline interpolation for E(t)
time_smooth = np.linspace(min(time), max(time), 300)
spl_E_t = make_interp_spline(time, E_t, k=3)  # Cubic spline
E_t_smooth = spl_E_t(time_smooth)

# Calculate t * E(t)
t_E_t = time_smooth * E_t_smooth

# Calculate the mean residence time using the trapezoidal rule
mean_residence_time = trapz(t_E_t, time_smooth)

# Display the result
print(f"The mean residence time (τ_m) is: {mean_residence_time:.4f} min")
Output: The mean residence time (τ_m) is: 5.0994 min
In summary, we have constructed the C Curve, E Curve and F Curve for the given data and then calculated the mean residence time.
Related: PFR and CSTR in Series or Parallel Combination for a single reaction
Difference between C Curve, E Curve and F Curve
The C Curve, E Curve, and F Curve are used in the study of tracer dynamics within reaction engineering, in the analysis of residence time distribution (RTD) in reactors. These curves provide insights how a tracer behaves as it moves through a system. Here we have provided explanation for each curve.
| Characteristic | C Curve | E Curve | F Curve |
|---|---|---|---|
| Definition | Cumulative Distribution Function (CDF) | E-Distribution Function | F-Distribution Function |
| Shape | S-shaped | Peak-shaped | Similar to E Curve but focuses on volume |
| Key Characteristics | – Indicates cumulative amount of a substance over time – Steeper slope indicates efficient mixing | – Represents residence time distribution of particles – Most particles spend short time in the system | – Indicates fraction of volume occupied by particles – Helps analyze flow patterns |
| Applications | – Evaluating mixing performance – Characterizing flow in mixers and reactors | – Reactor design – Determining residence time distribution (RTD) | – Understanding flow behavior in mixing processes – Optimizing reactor design |
| Mathematical Representation | C(t) = ∫ E(τ) dτ | E(t) = dC(t)/dt | F(t) = E(t)/∫ E(τ) dτ |
Resources:
- Chemical Reactor Analysis and Design Fundamentals by Rawlings and Ekerdt
- Elements of Chemical Reaction Engineering by Fogler
- “Chemical Reaction Engineering“ by Octave Levenspiel
Disclaimer: The content provided here is for educational purposes. While efforts ensure accuracy, results may not always reflect real-world scenarios. Verify results with other sources and consult professionals for critical applications. Contact us for any suggestions or corrections.